Watch your apps scale with their traffic
A scaling policy now gives a web application more replicas when its load grows. A worker node pool adds the servers they need. A new Usage tab shows how close each replica runs to its CPU and memory limits.
The day a post about your app reaches Hacker News, three replicas that were plenty yesterday start to queue requests. Tenkai can now add the replicas for you along with the servers they need. It also shows you which applications run short of CPU or memory before your users feel it.
A scaling policy for each web application
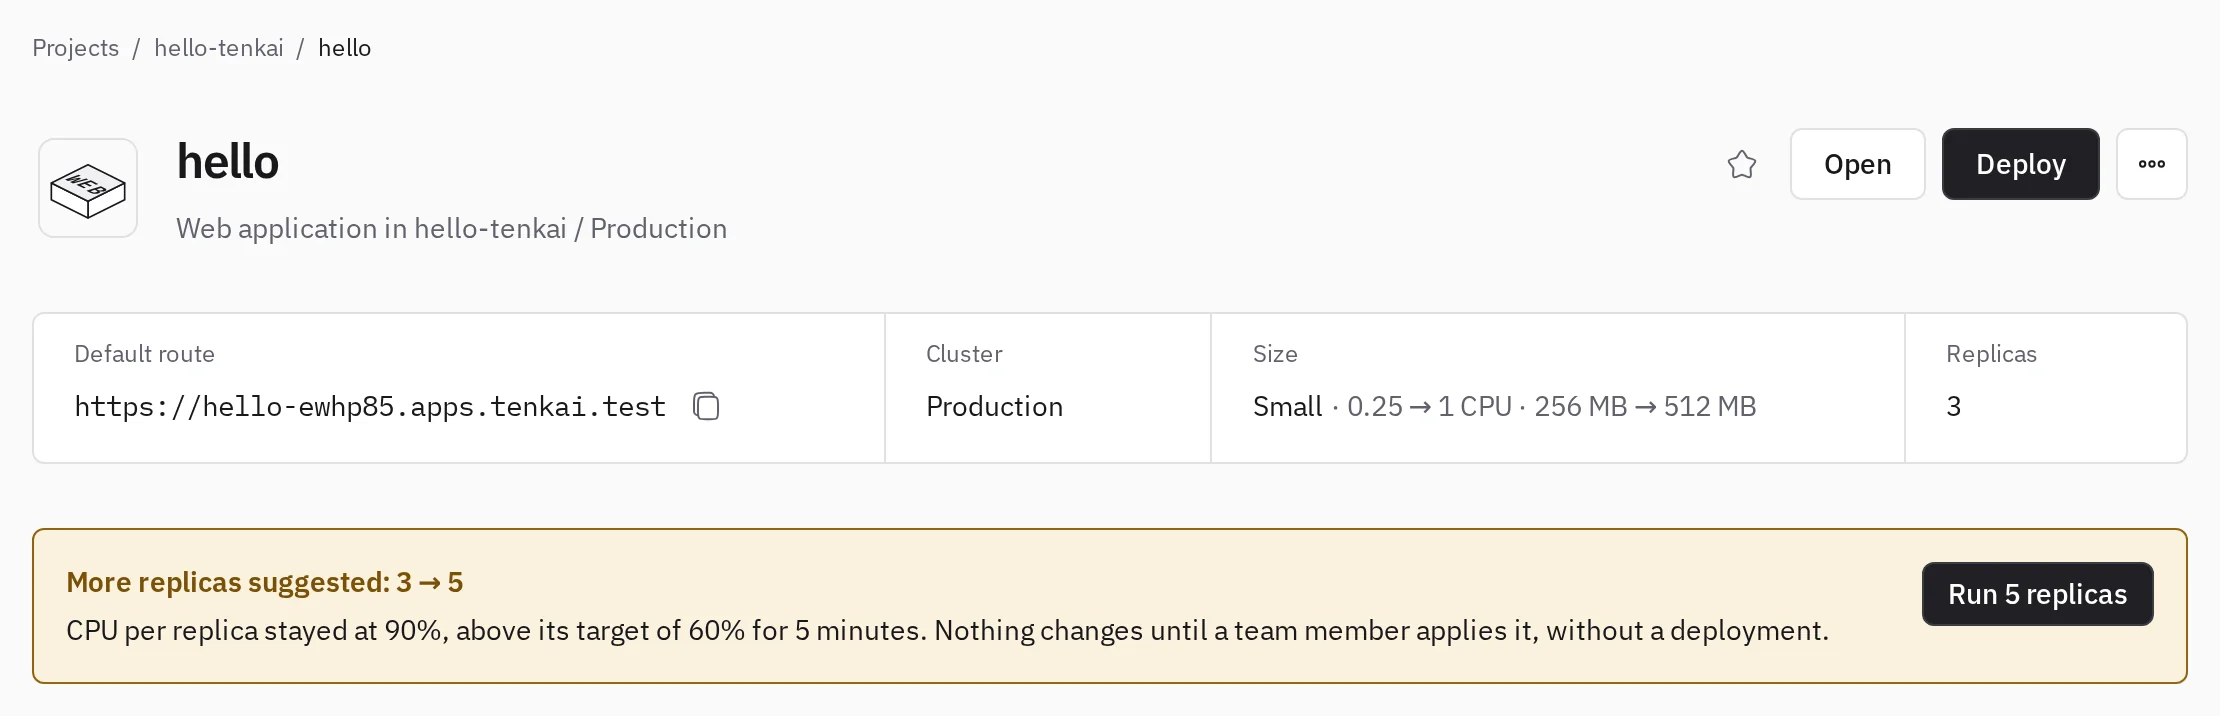
Open a web application, then Set up on Scaling policy in its Configuration tab. Choose a minimum and a maximum of replicas. Then set the targets the policy holds, such as 60% of the CPU limit, 100 requests a minute per replica or a p95 latency of 300 ms.
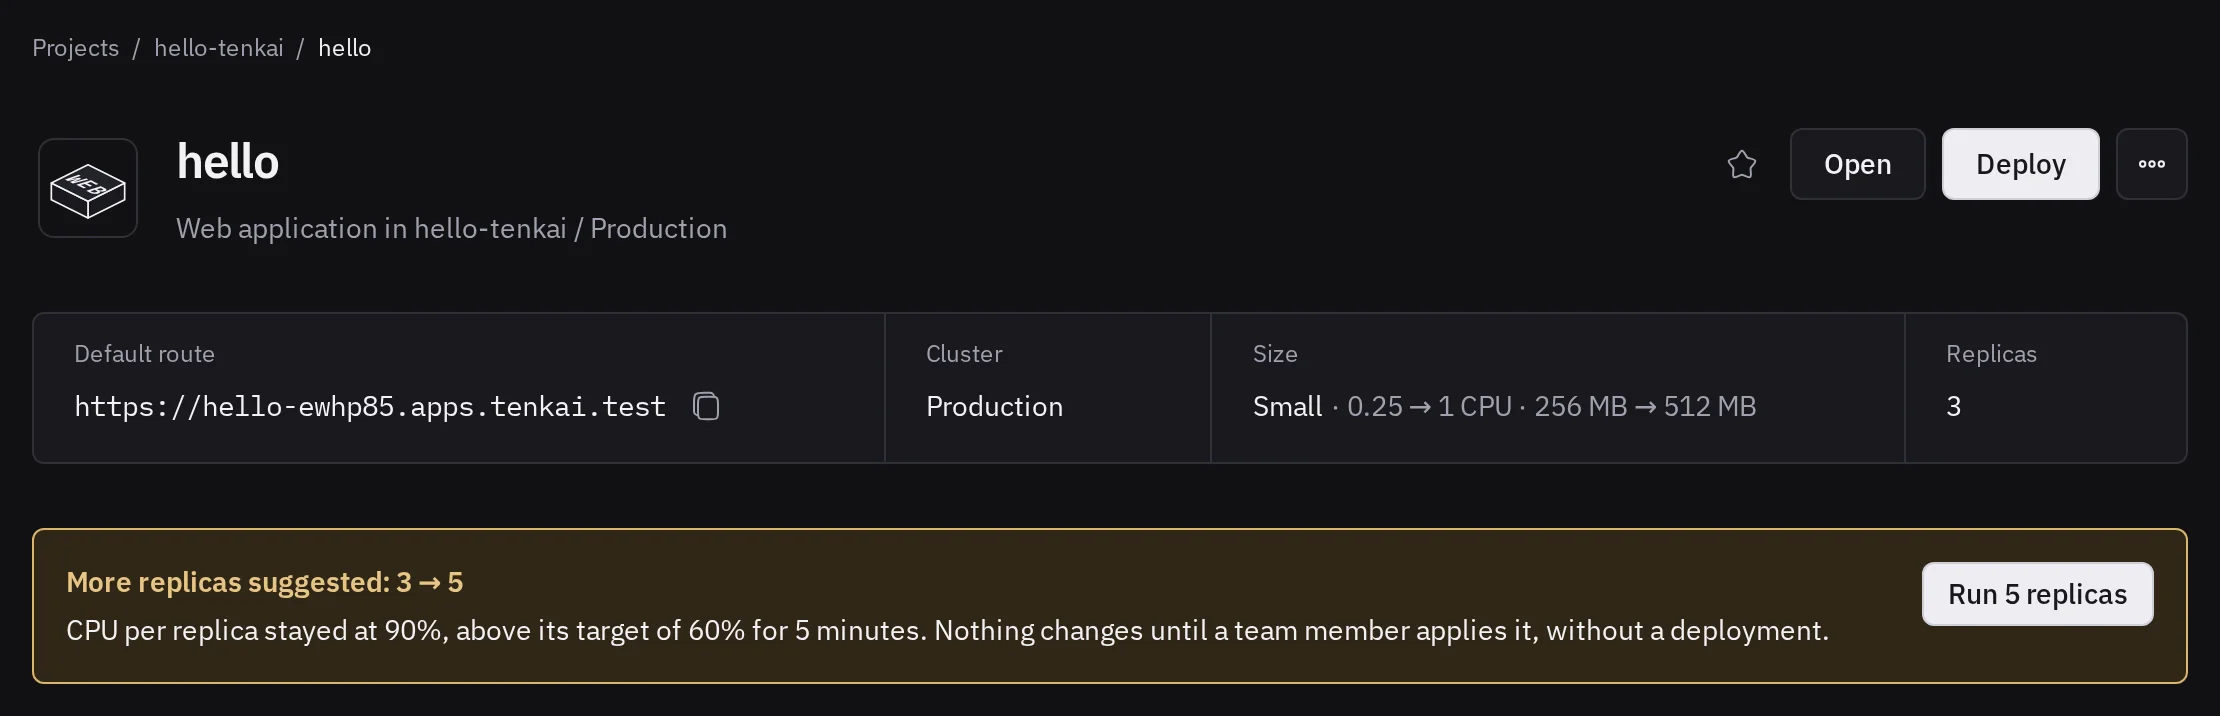
Tenkai reads the load every minute. Once a signal stays off its target for 5 minutes, it brings the replicas back in line. In Alert mode the application shows the new number with its reason, so a team member runs it in one click. In Automatic mode Tenkai runs it itself and keeps a history of each change. It gives replicas back one at a time once the load goes down.
See Scaling policy for how each signal decides.
A worker node pool that grows your cluster
More replicas need room on your nodes, so a cluster can now get a worker node pool. You choose a minimum and a maximum of nodes, the provider connection, the location and the server type, with one or two fallbacks for the day your provider runs out of it.
When replicas wait for room, the pool adds a worker node. In automatic mode it also removes a node your cluster no longer needs, so you stop paying for it. A node takes a few minutes to set up, which makes the pool a good fit for a load that grows over the day.
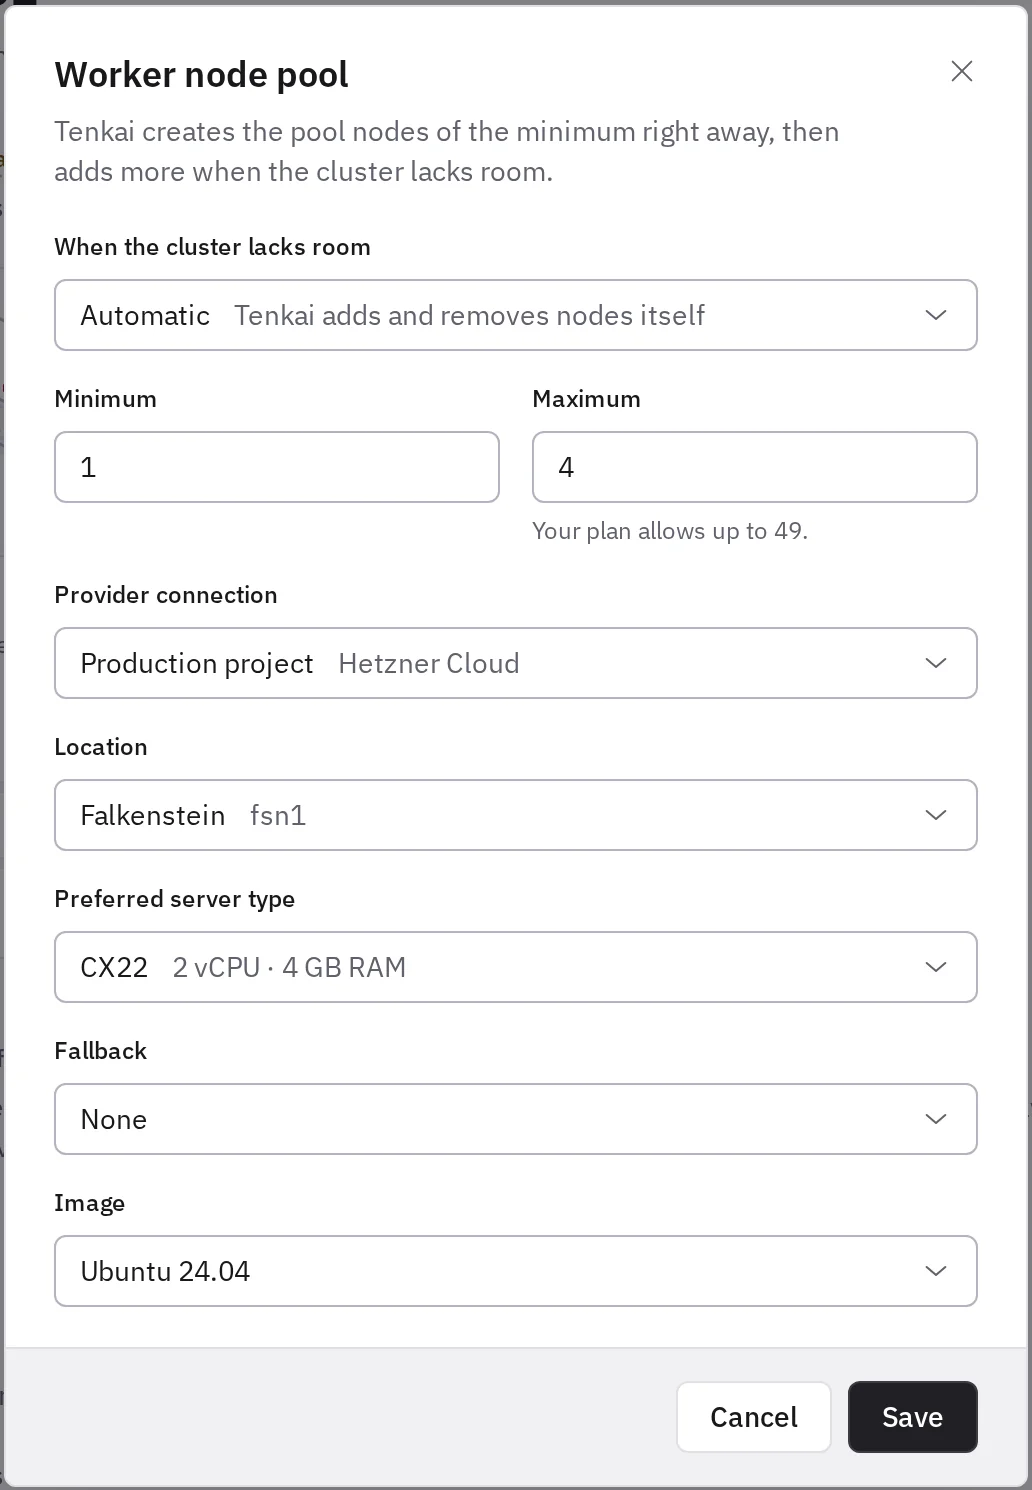
See Worker node pool to set one up.
Try them
Both are still experimental, so an owner or admin turns on Autoscaling under Experimental in the team settings. Your agent can set up a policy or a pool too. It asks you first before a pool creates servers.
See what each replica uses
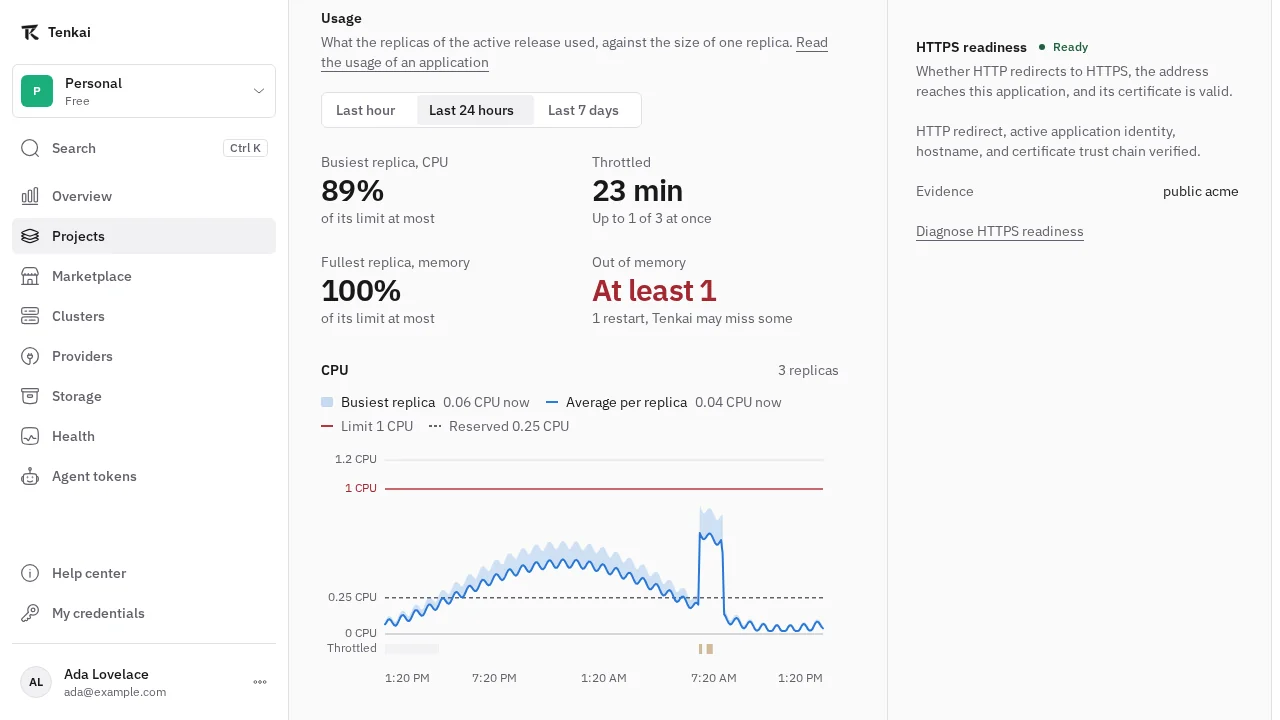
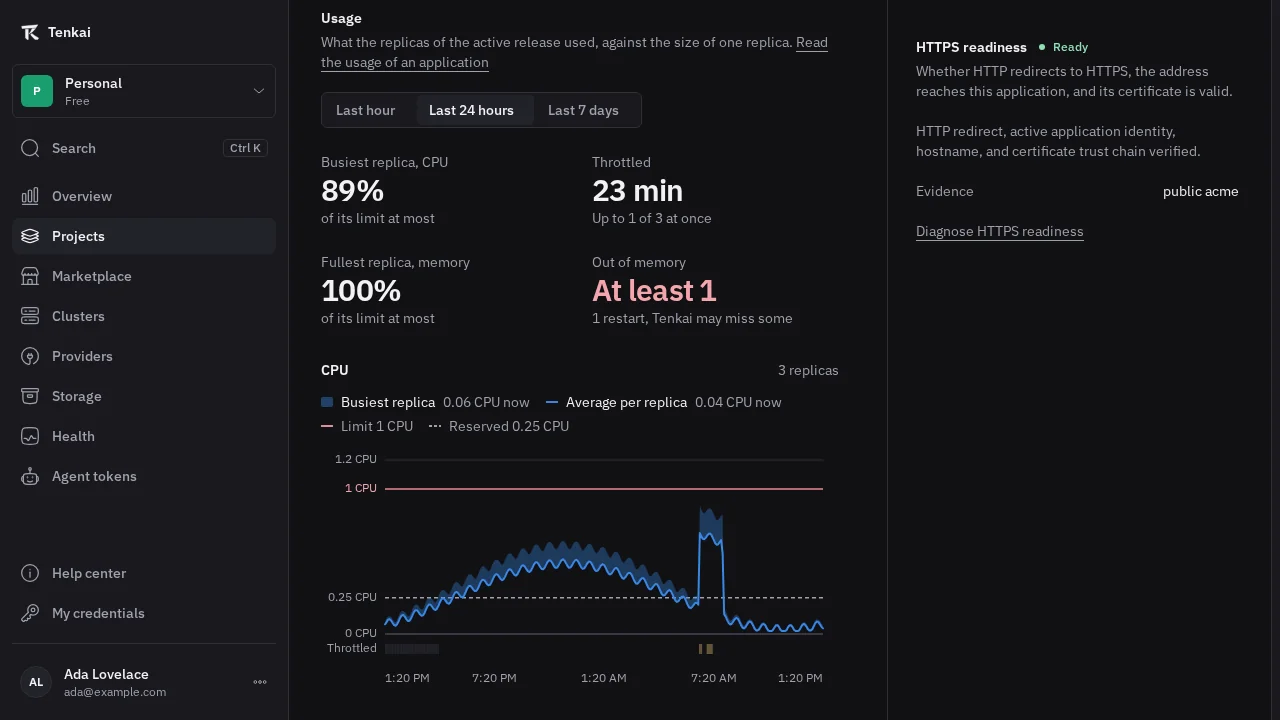
Every web application and worker now has a Usage tab, with charts of the CPU and memory its replicas use against the size it runs with, over the last hour, day or week. The limit holds each replica on its own, so the charts show the average replica and shade up to the busiest one. When both reach the limit, every replica is busy and needs more room. When only the busiest does, the load is uneven or one replica leaks memory, which a larger size would only delay.
The CPU chart shows when the limit held a replica back, even in bursts that a one-minute average hides. The memory chart marks each replica that ran out of memory, with whether it reached its own limit or its server ran out of memory. A project's Usage tab compares all its applications over the last day, so the one that runs short stands out.
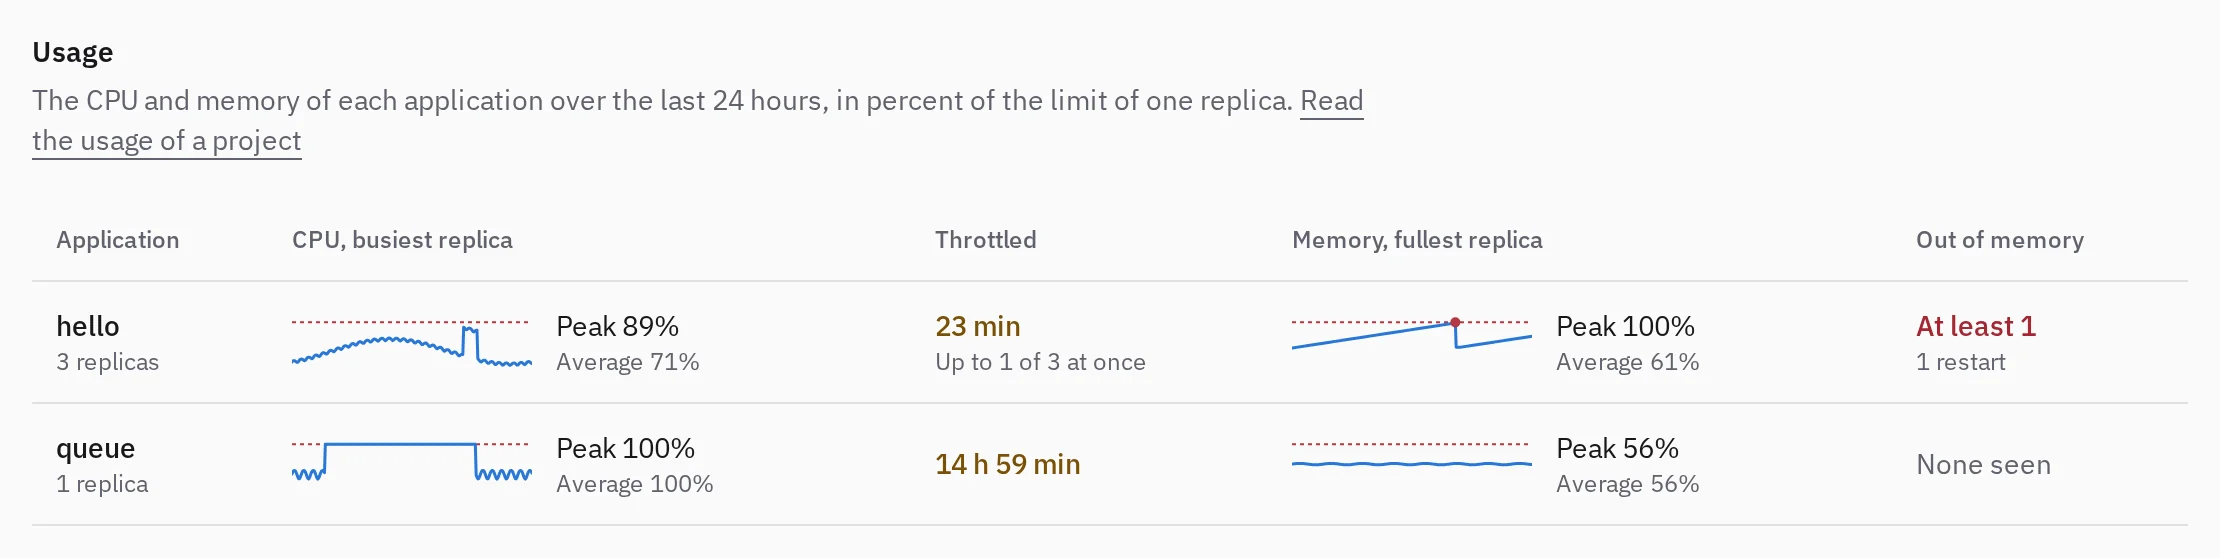
The throttling, the memory peaks and the out of memory come from the Tenkai Agent 0.10, which your servers install on their own within the hour. On a cluster that turned off its automatic updates, update the agent from each server page.
See Read an application's CPU and memory for everything the charts show.