Read an application's CPU and memory
See how close the replicas of a web application or a worker come to their size, when their CPU limit holds them back and when one runs out of memory.
Updated
Every web application and worker gets charts of the CPU and memory its replicas use, against the size each replica runs with, so you see when it needs more room before your users do.
What the usage tab shows
Open a web application or a worker, then its Usage tab. Above the charts, choose a period of 1 hour, 24 hours or 7 days.
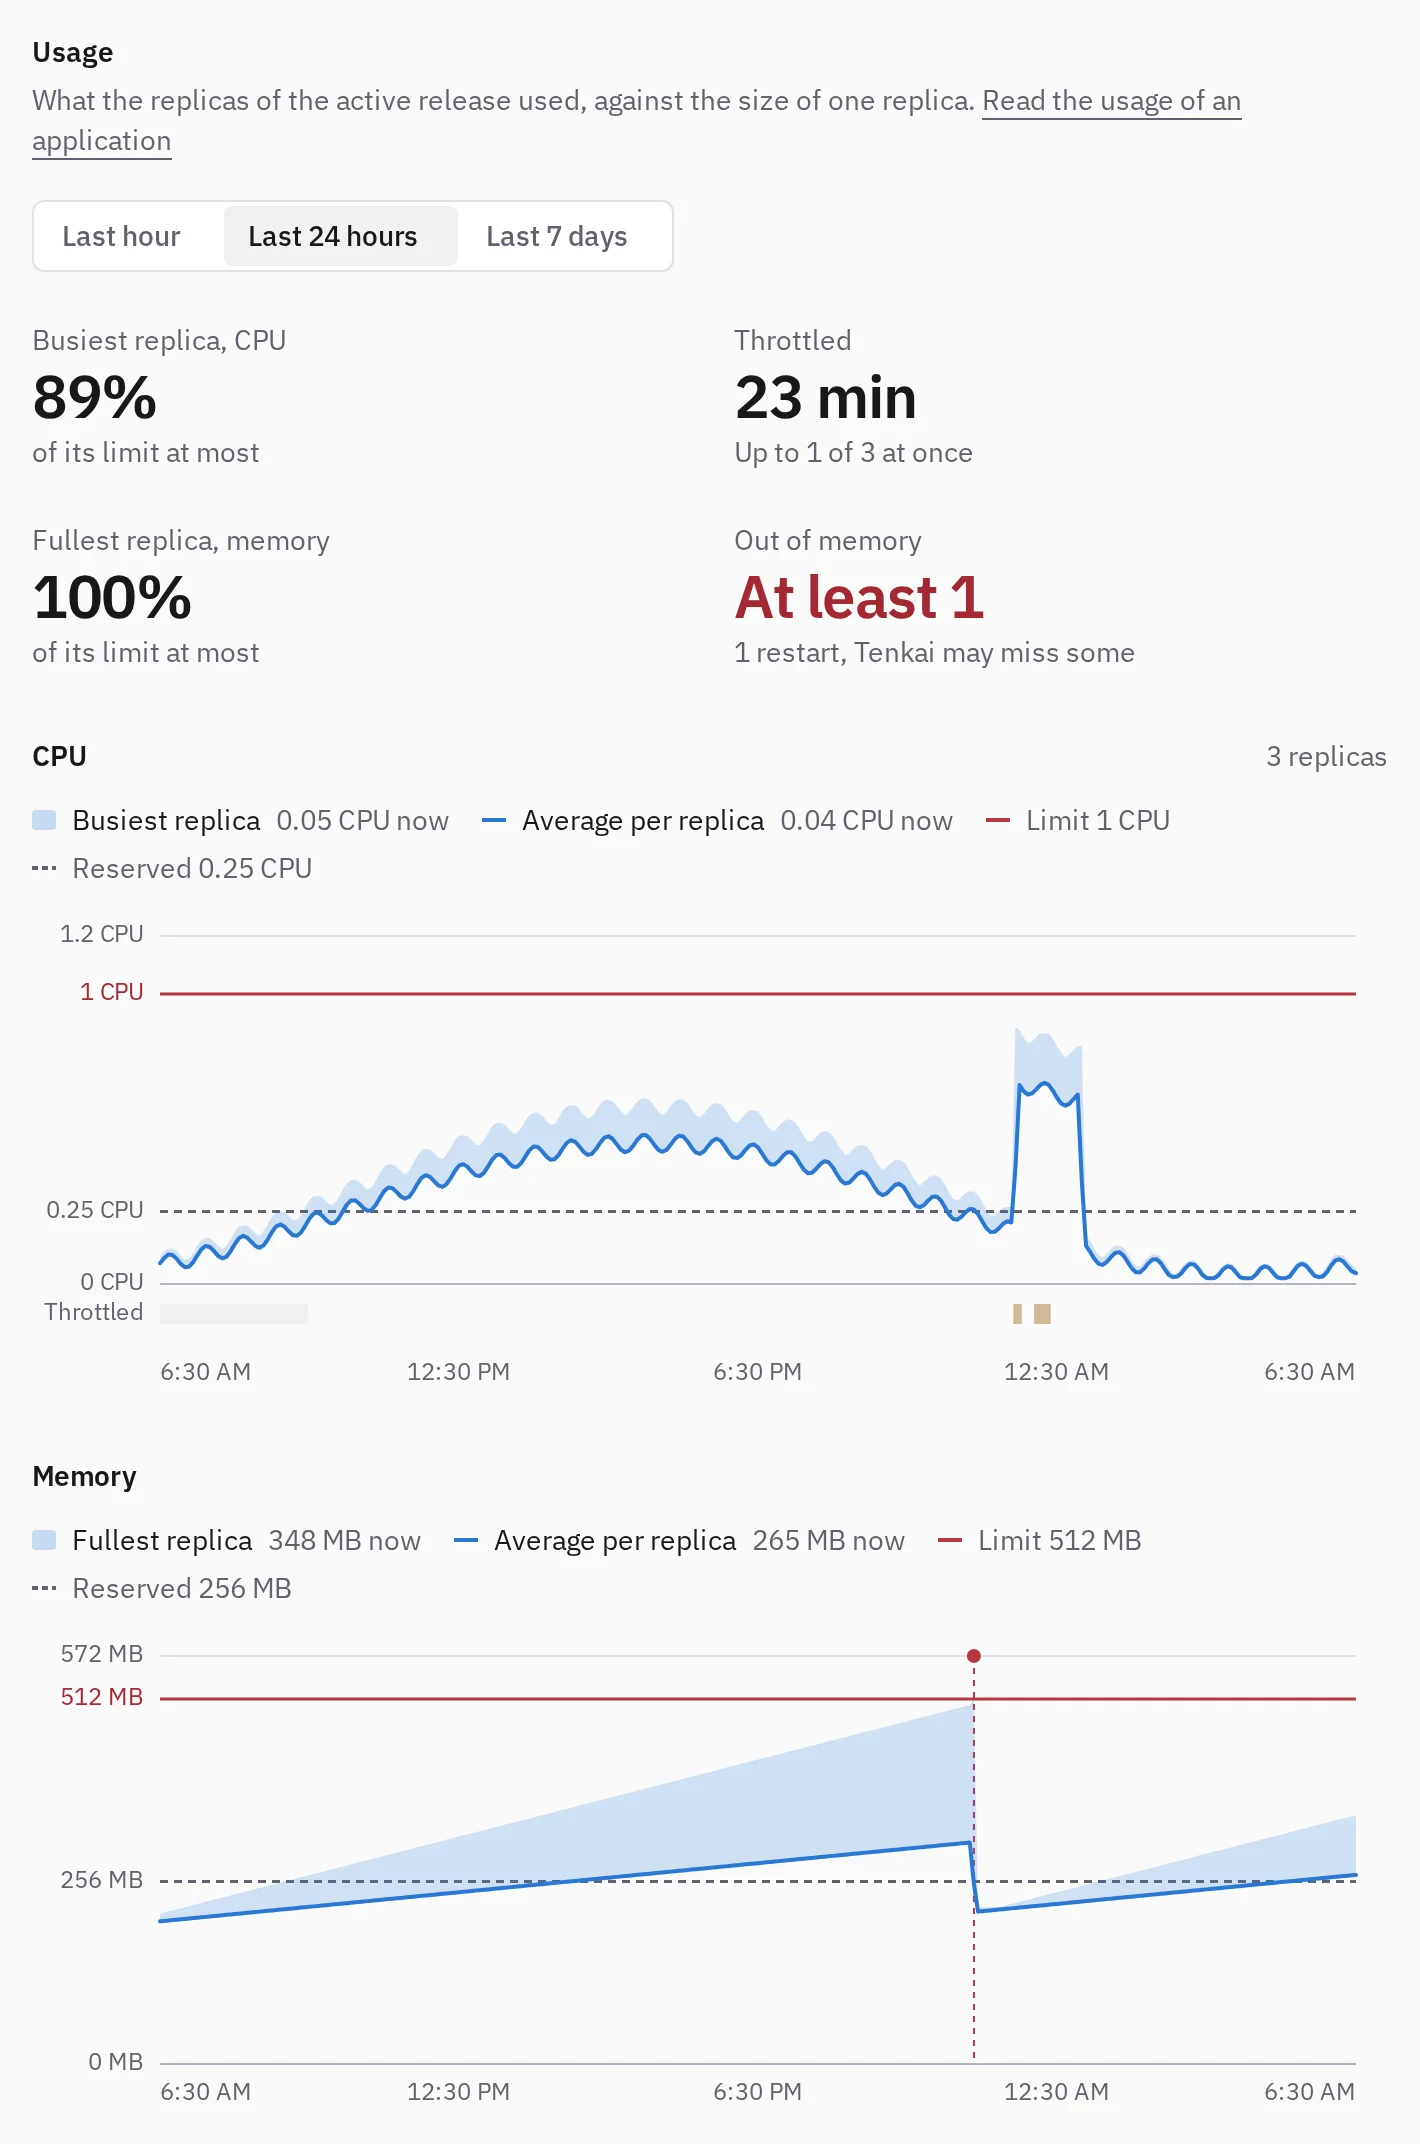
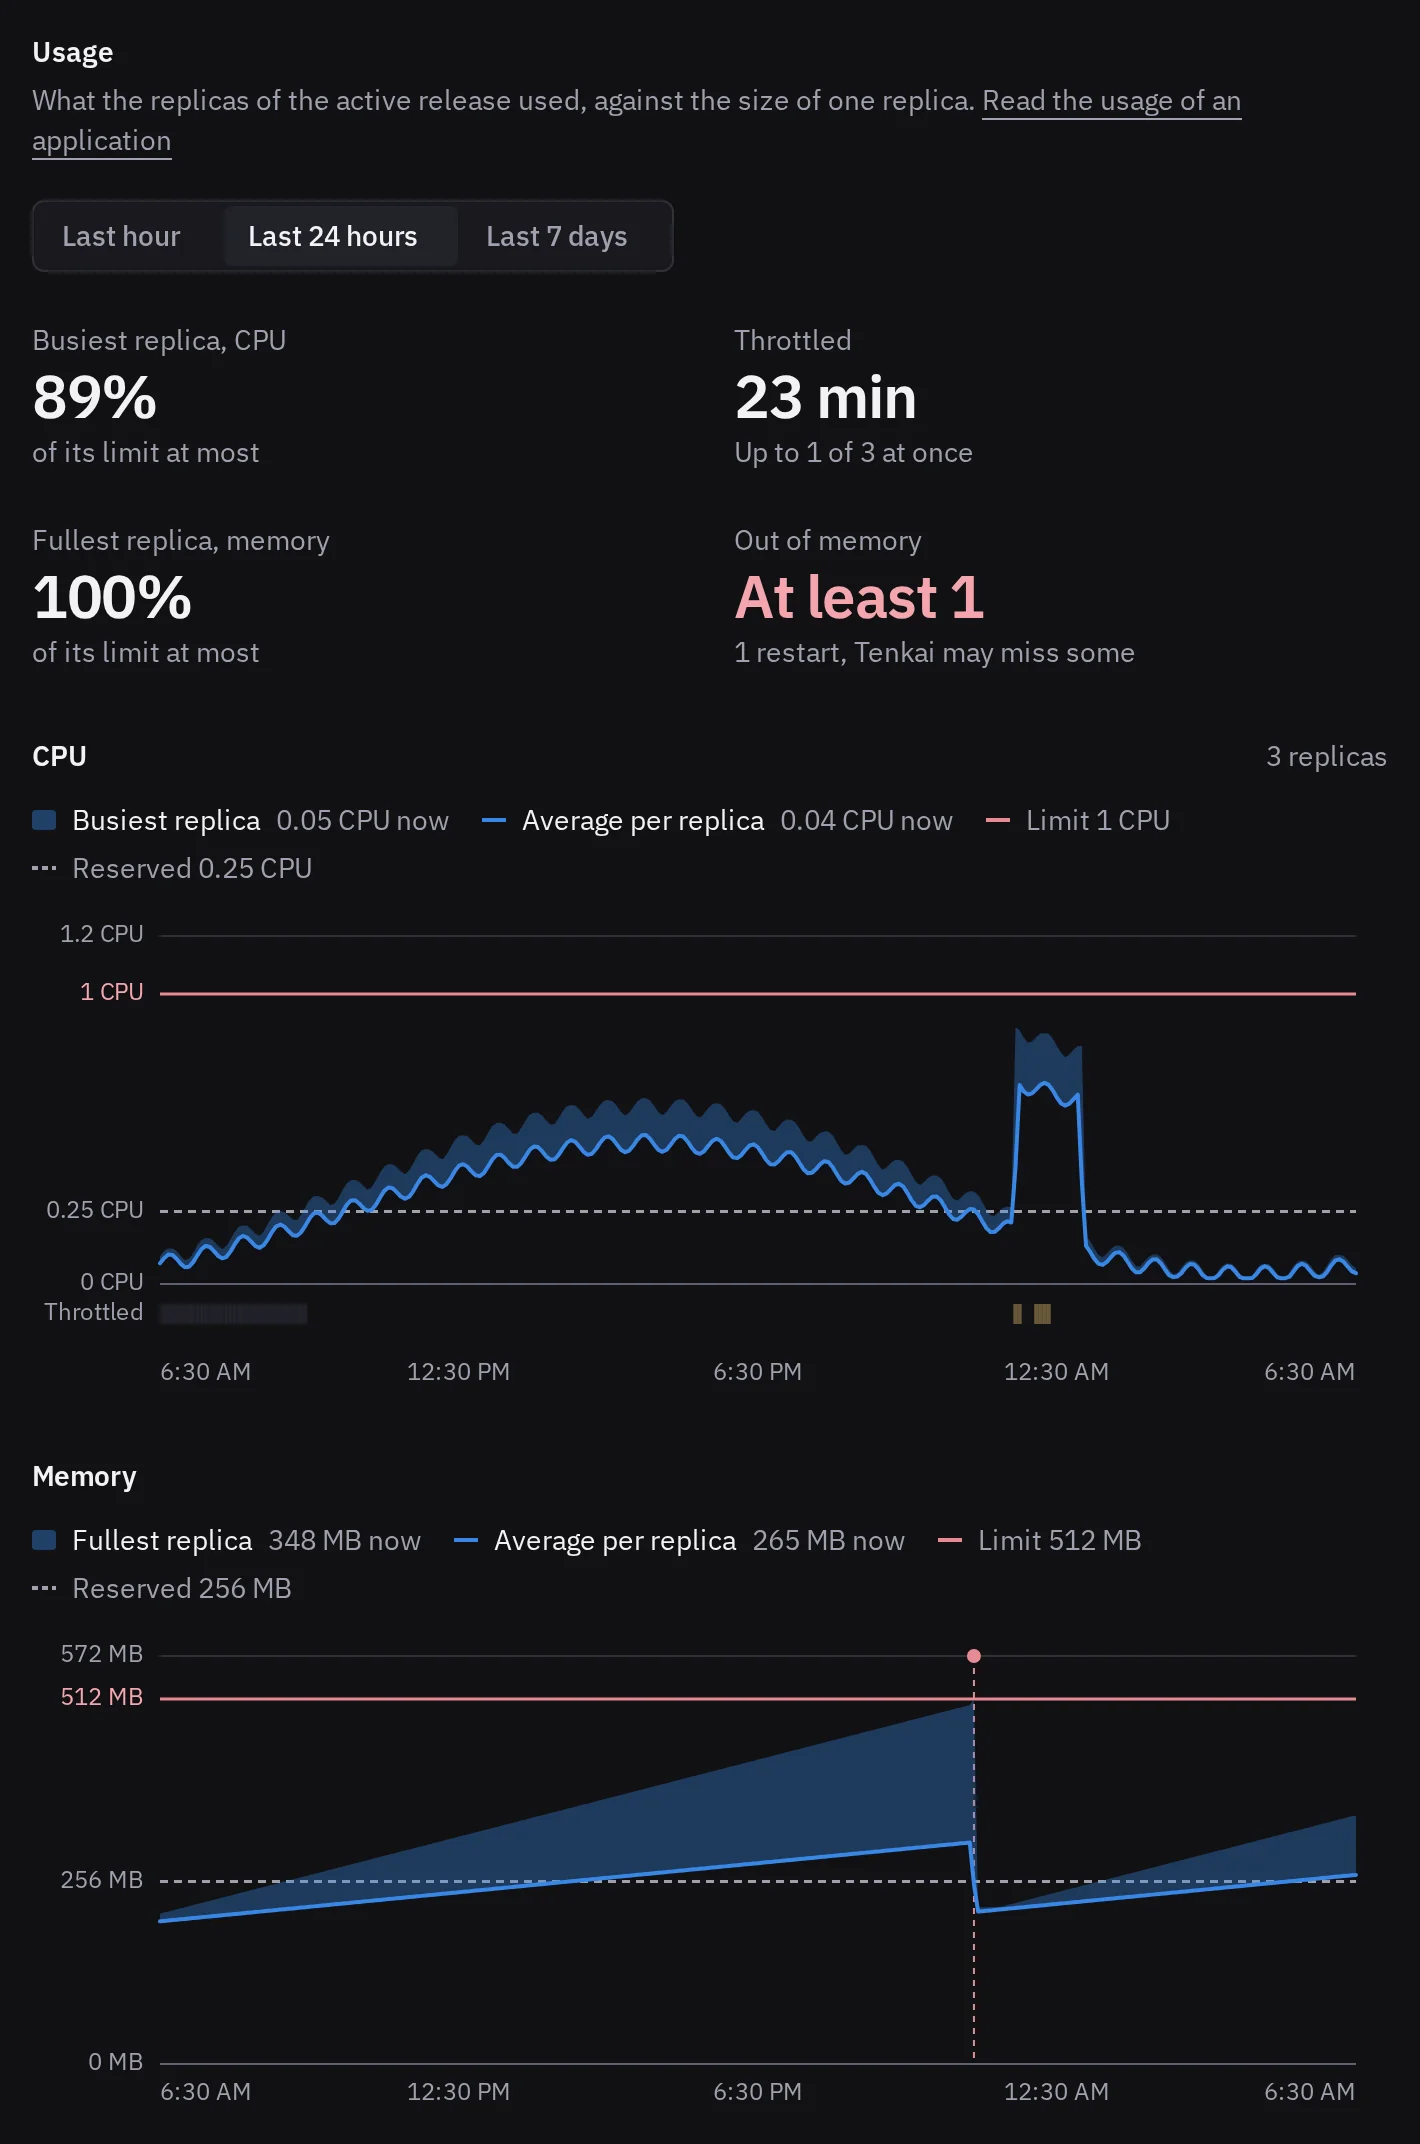
- Busiest replica, CPU and Fullest replica, memory give the most one replica used, in percent of its limit.
- Throttled is the time during which the CPU limit held a replica back, and how many replicas it held back at once.
- Out of memory counts the replicas that ran out of memory, either because the kernel killed one of their processes or because the replica stopped and restarted.
Each chart draws a line of what one replica used on average. The shaded area reaches up to the busiest replica. The red line is the limit of one replica and the dashed line is what it reserves on its node, as its size sets them. A size you save runs from the next deployment, so the charts follow the size that runs.
Read the busiest replica against the average
The limit holds each replica on its own, so a replica at its limit is held back however quiet the others are. Compare the shaded area with the line.
When the line rises close to the limit with the shaded area, every replica is busy. More replicas share the CPU between them, while the next size gives each replica more memory. When only the shaded area reaches the limit, one replica works much harder than the others. That happens when the load is unevenly spread, or when one replica leaks memory.
Read the throttling
The strip under the CPU chart darkens when more of a minute was throttled. Hover it to see how many replicas were held back. A replica counts once its limit held it back for 3 seconds of a minute, so a replica that only wakes for a few short bursts does not. The CPU limit counts in periods of 100 ms, so a replica can be throttled in short bursts while its average over the minute stays well under the line. A replica throttled often answers more slowly. Give it a larger CPU limit or more replicas to fix it.
A grey strip means your nodes run a Tenkai Agent that does not read the throttling yet. Update the agent from the server page.
Read an out of memory
A red dot marks each replica that ran out of memory. A replica that restarts for it loses what it was doing. It happens when a replica reaches its memory limit, or when the whole server runs out of memory. Tenkai counts the most memory each replica held during the minute, so a replica that reached its limit shows at 100%. Give it the next size for more memory. Hover a dot to see whether its server ran out of memory instead. Then the application was not at fault: the server's other services took its room, so look at your nodes and their room. When the Tenkai Agent could not tell which of the two it was, the dot only says the replica ran out of memory.
A replica that runs out of memory as it starts stops before Tenkai reads it. Its average stays empty, while the red dots show with the fullest replica at its limit. Give it the next size.
Tenkai counts each process the kernel killed for memory, such as a child process killed again and again in a replica that keeps running. It tells you how many restarts it caused, or in how many running replicas it happened. Each restart starts the replica again, so a single replica that keeps running out of memory reads as many restarts, not as many replicas. Tenkai shows only what it saw and may miss some, so the count reads as at least.
CPU and memory alerts
Tenkai reads the usage of your web applications and workers for you. When one runs short of CPU or memory, it tells you what to do about it. You see the alert next to the application's name, at the top of its Usage tab and in the CPU and memory section of Health. Owners and admins get an email the first time it opens that day.
An alert opens once the fullest replica stayed above 90% of its memory limit for a quarter of the last hour, once every replica was throttled for a quarter of the last hour, or as soon as a replica reaches its memory limit. A short spike, such as a deployment or a cron job of a few minutes, opens none. The alert closes by itself once the usage settles, or when you change the size.
- Needs more memory or Needs more CPU means every replica runs short, so the application needs a larger size. Each replica holds its own memory, so more replicas would not help it. Tenkai suggests the next size, or a custom size with twice what runs short once the application already runs Large. When you choose Switch to on the alert, Tenkai saves that size and applies it without a build, along with any other change you saved. The email has the same button, which opens the confirmation on the application's page.
- Uneven memory or Uneven CPU means one replica works much harder than the others. A larger size only delays a memory leak, so look in that replica's logs for what keeps growing, or at what sends it most of the work.
A web application whose scaling policy targets its CPU gets more replicas from the policy, so Tenkai suggests no larger size for its CPU until the policy reaches its maximum of replicas. Then the alert also suggests raising that maximum.
When a server runs out of memory and its kernel kills a replica, the application was not at fault. You find the server under Server out of memory in Health. Owners and admins also get an email. Give the server more memory or move some applications to another node.
Compare the applications of a project
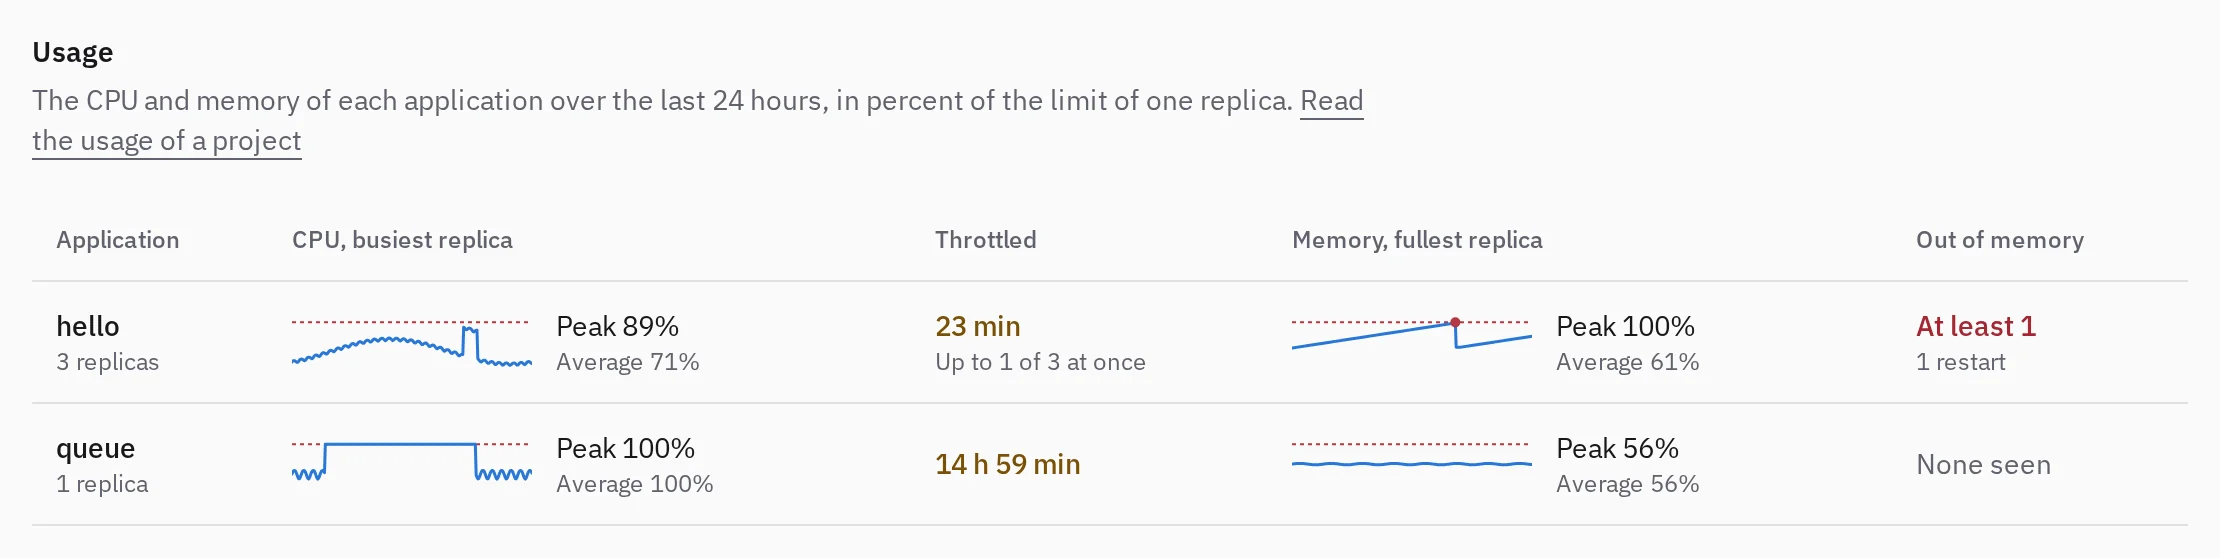
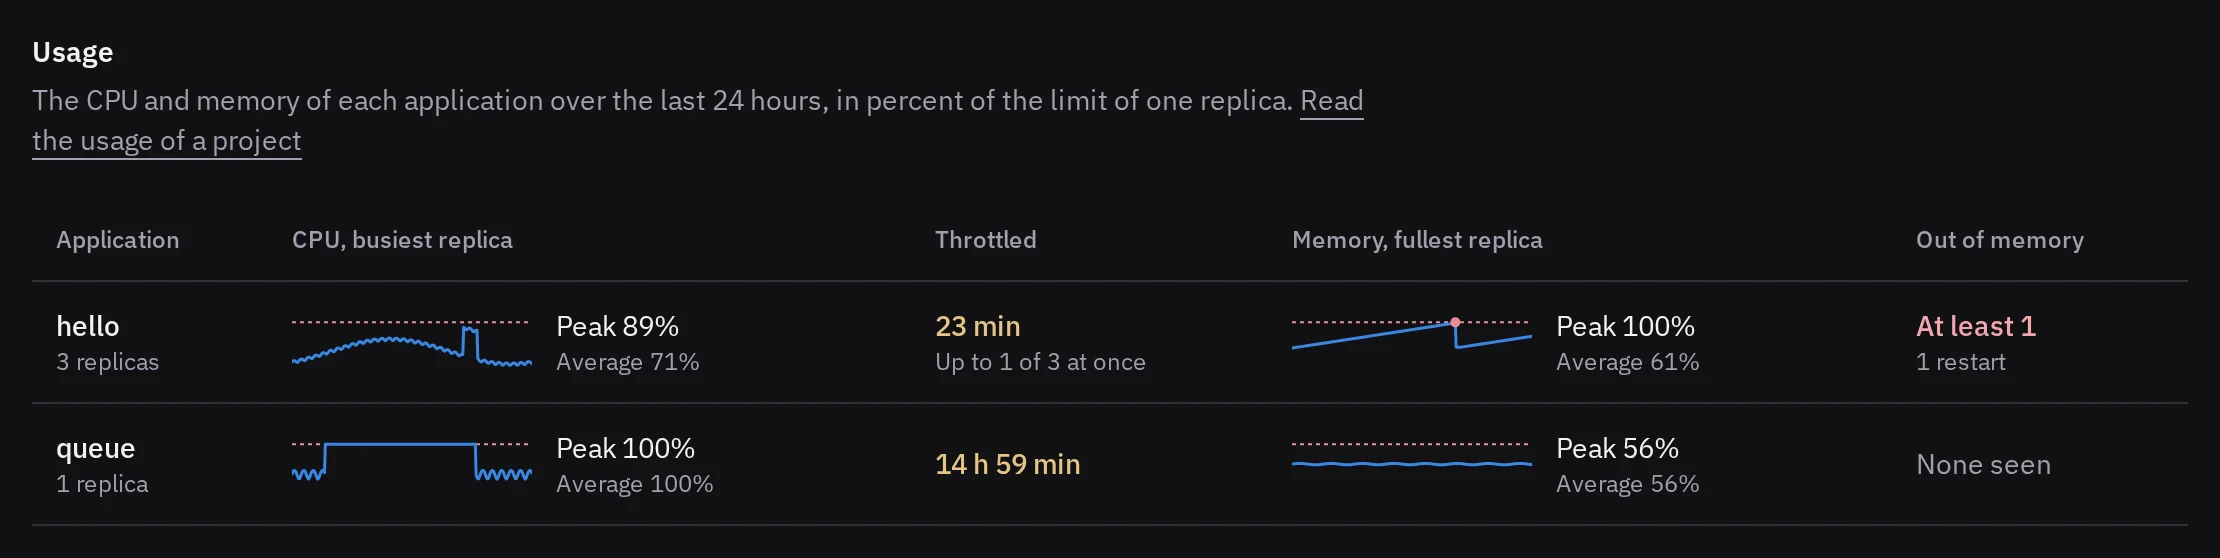
Open a project, then its Usage tab, to compare its web applications and workers over the last 24 hours. Each row shows its busiest replica against its limit, the peak of the busiest replica beside the peak of the average, the time it was throttled and how many replicas ran out of memory.
Read a gap in the chart
A line that stops means no node reported the replicas for that time, because its Tenkai Agent was stopped, the node could not reach Tenkai, the server was down or no replica ran long enough to be read. A node with a Tenkai Agent older than 0.9 reports no usage at all, so update it from its server page.