Read the traffic of a web application
Read the traffic tab of a web application: its requests by status class over time, what counts as a request, and what a gap in the chart means.
What the traffic tab shows
Open a web application, then its Traffic tab, to see the requests its cluster's edge router received for it.
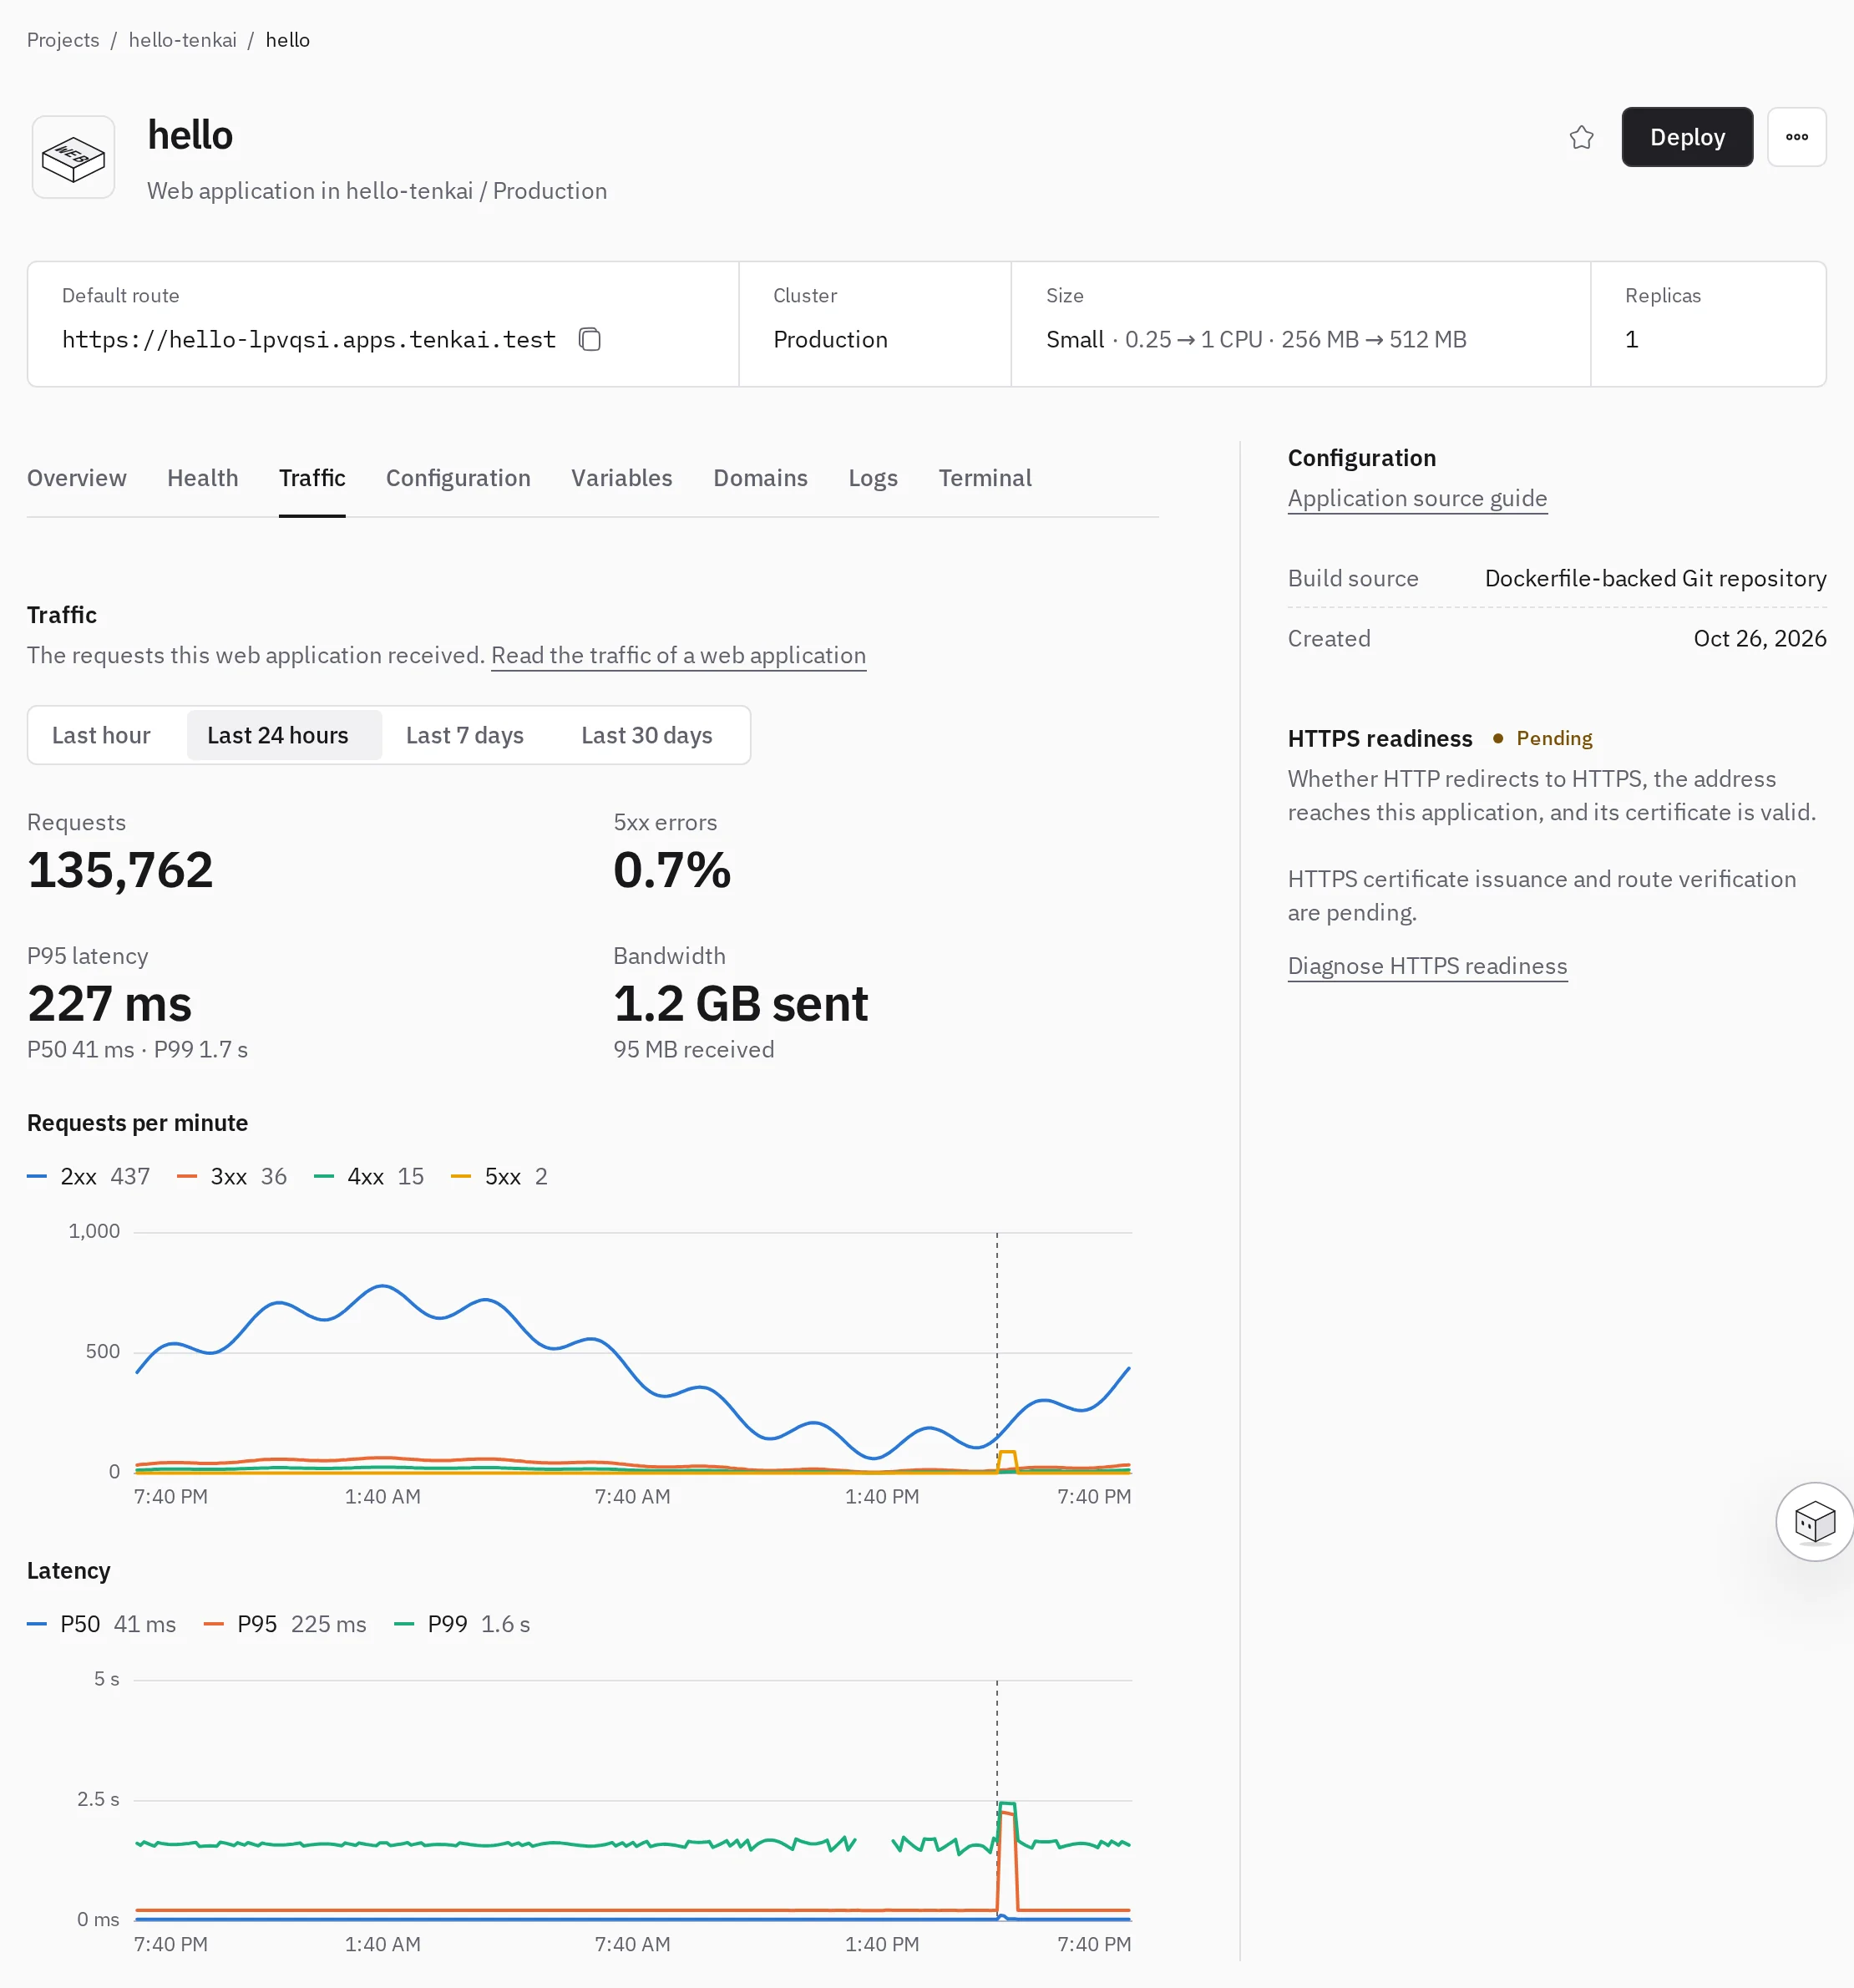
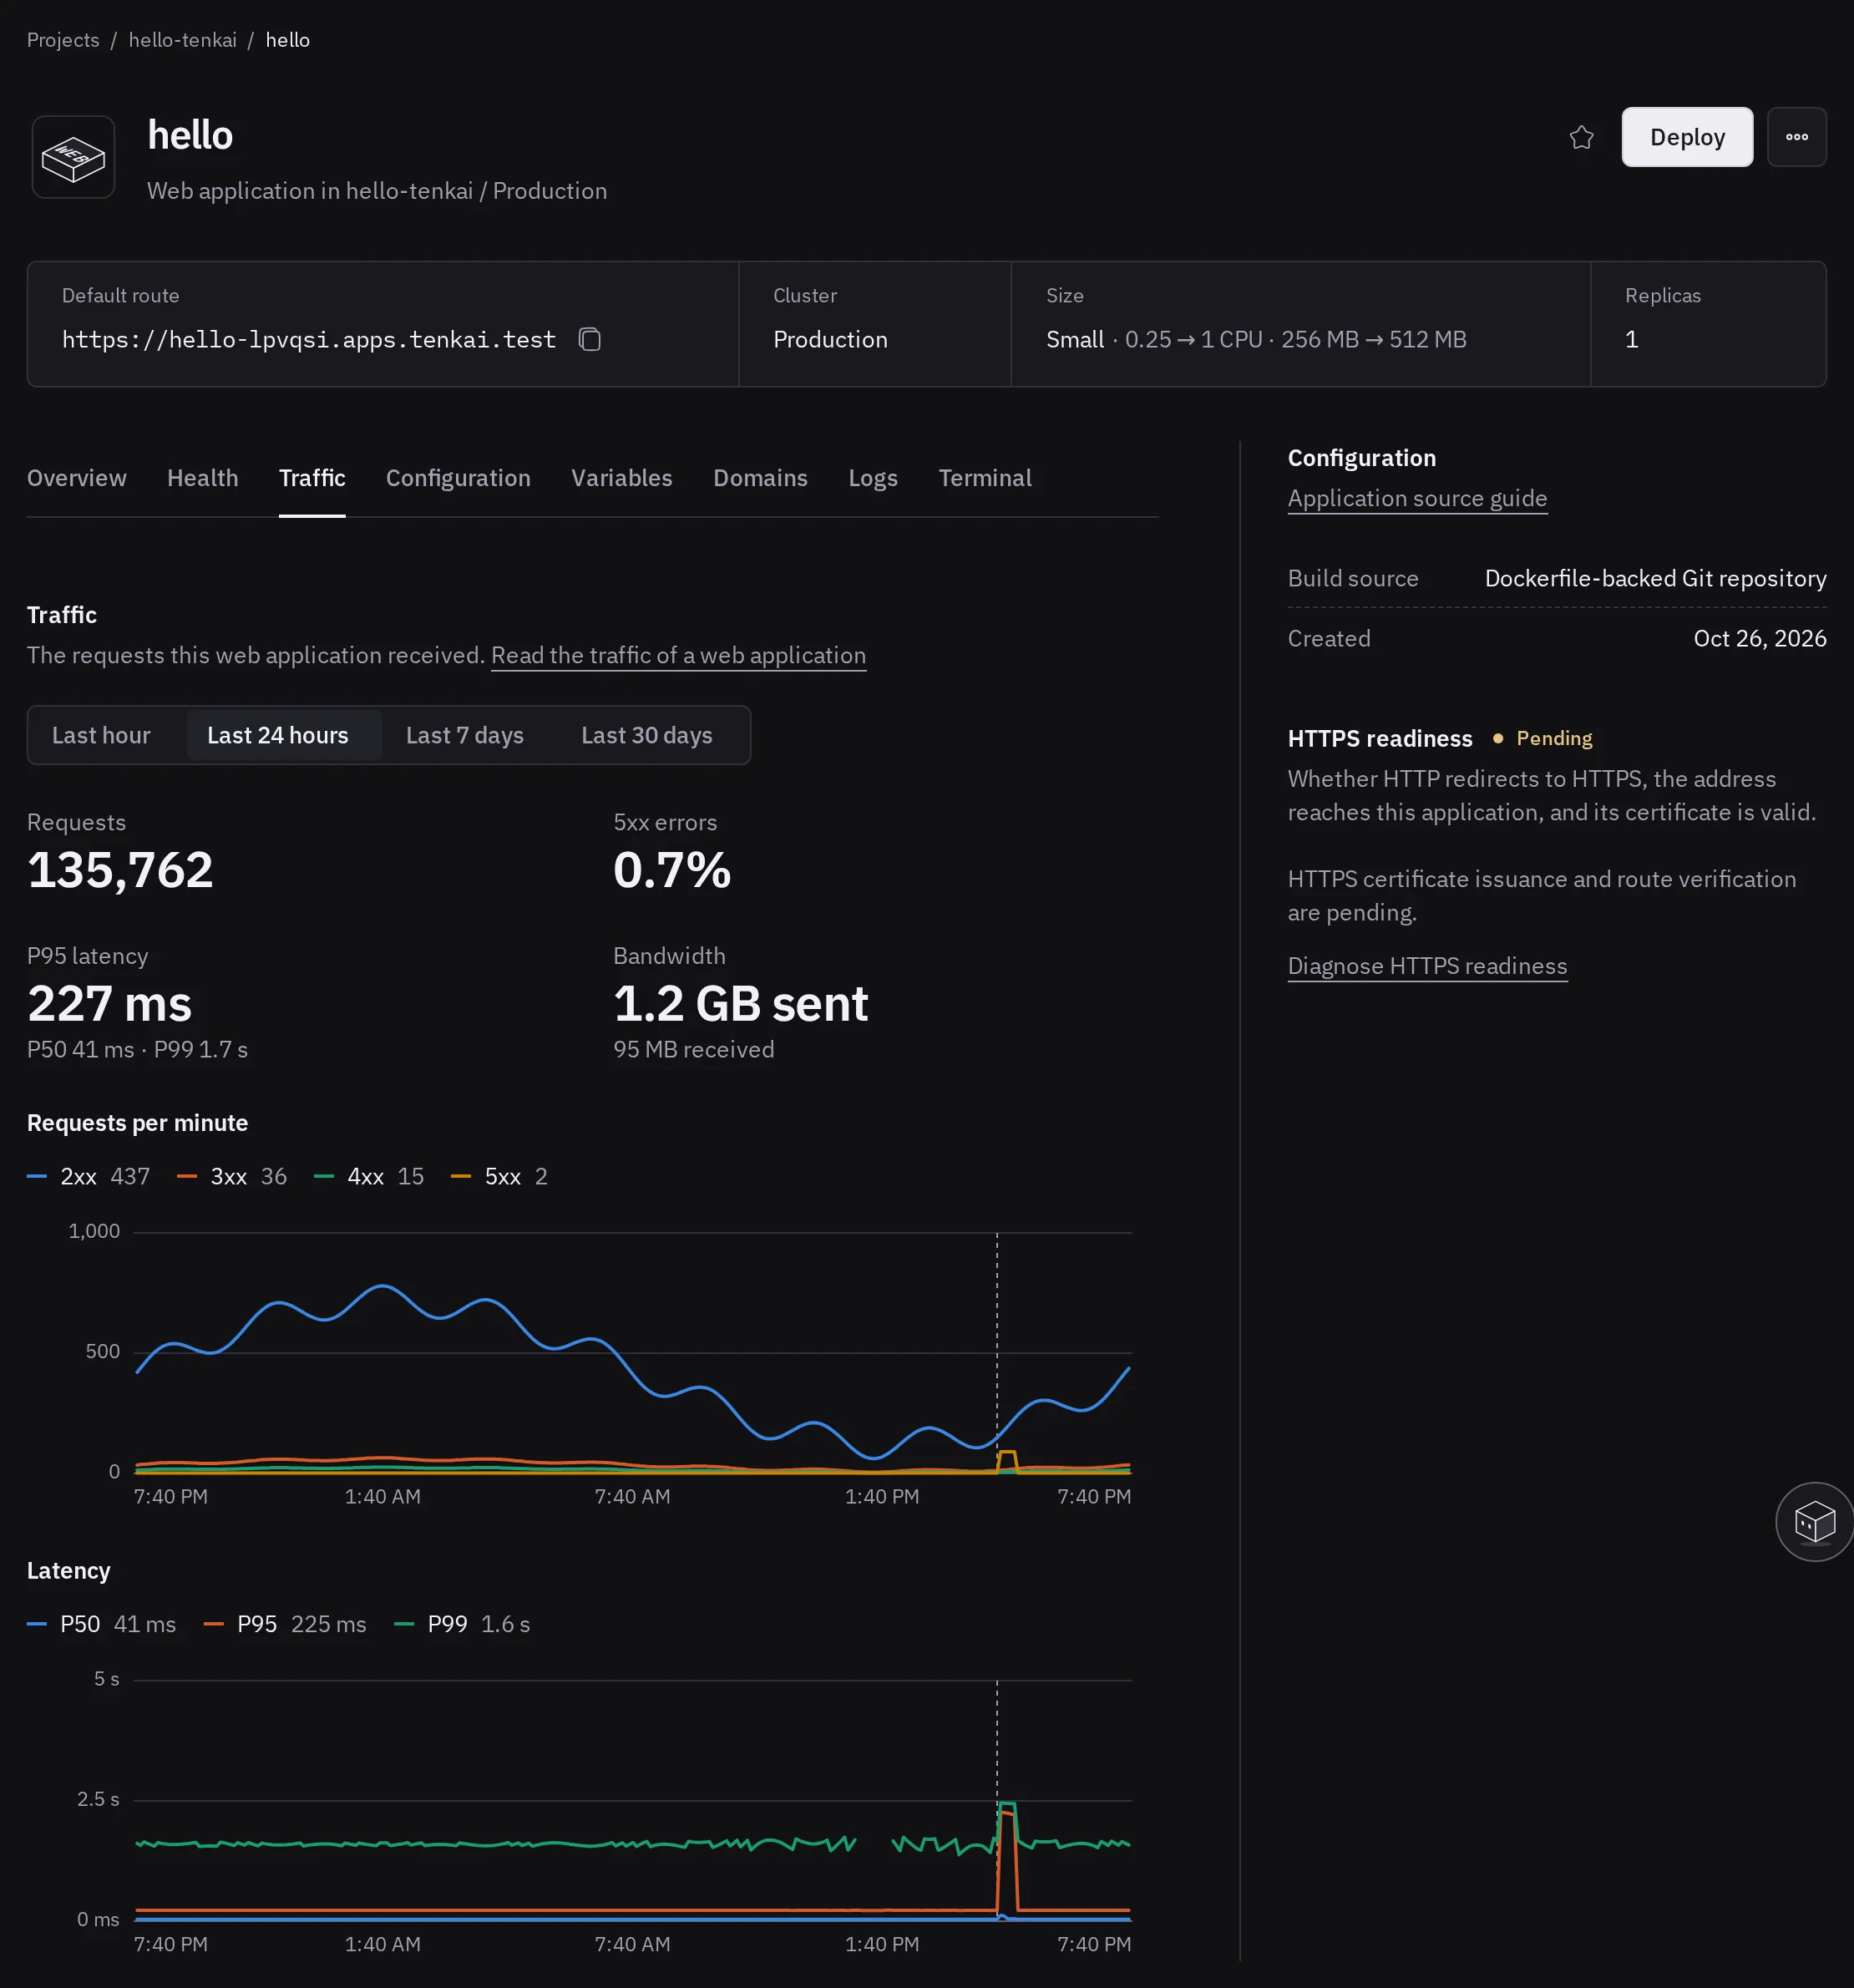
- 5xx errors is the share of requests answered with a status from 500 to 599.
- P95 latency is the time under which 95% of requests were answered. See Read the latency.
- Bandwidth counts request and response bodies, not headers.
A dashed line on the charts marks the end of a deployment, rollback, relocation or reconfiguration, so you can see whether errors or latency changed with it.
Choose the period above the chart: 1 hour, 24 hours, 7 days or 30 days. Tenkai keeps traffic for 30 days. It only counts requests: it keeps no visitor address, path or other request detail.
Compare the web applications of a project
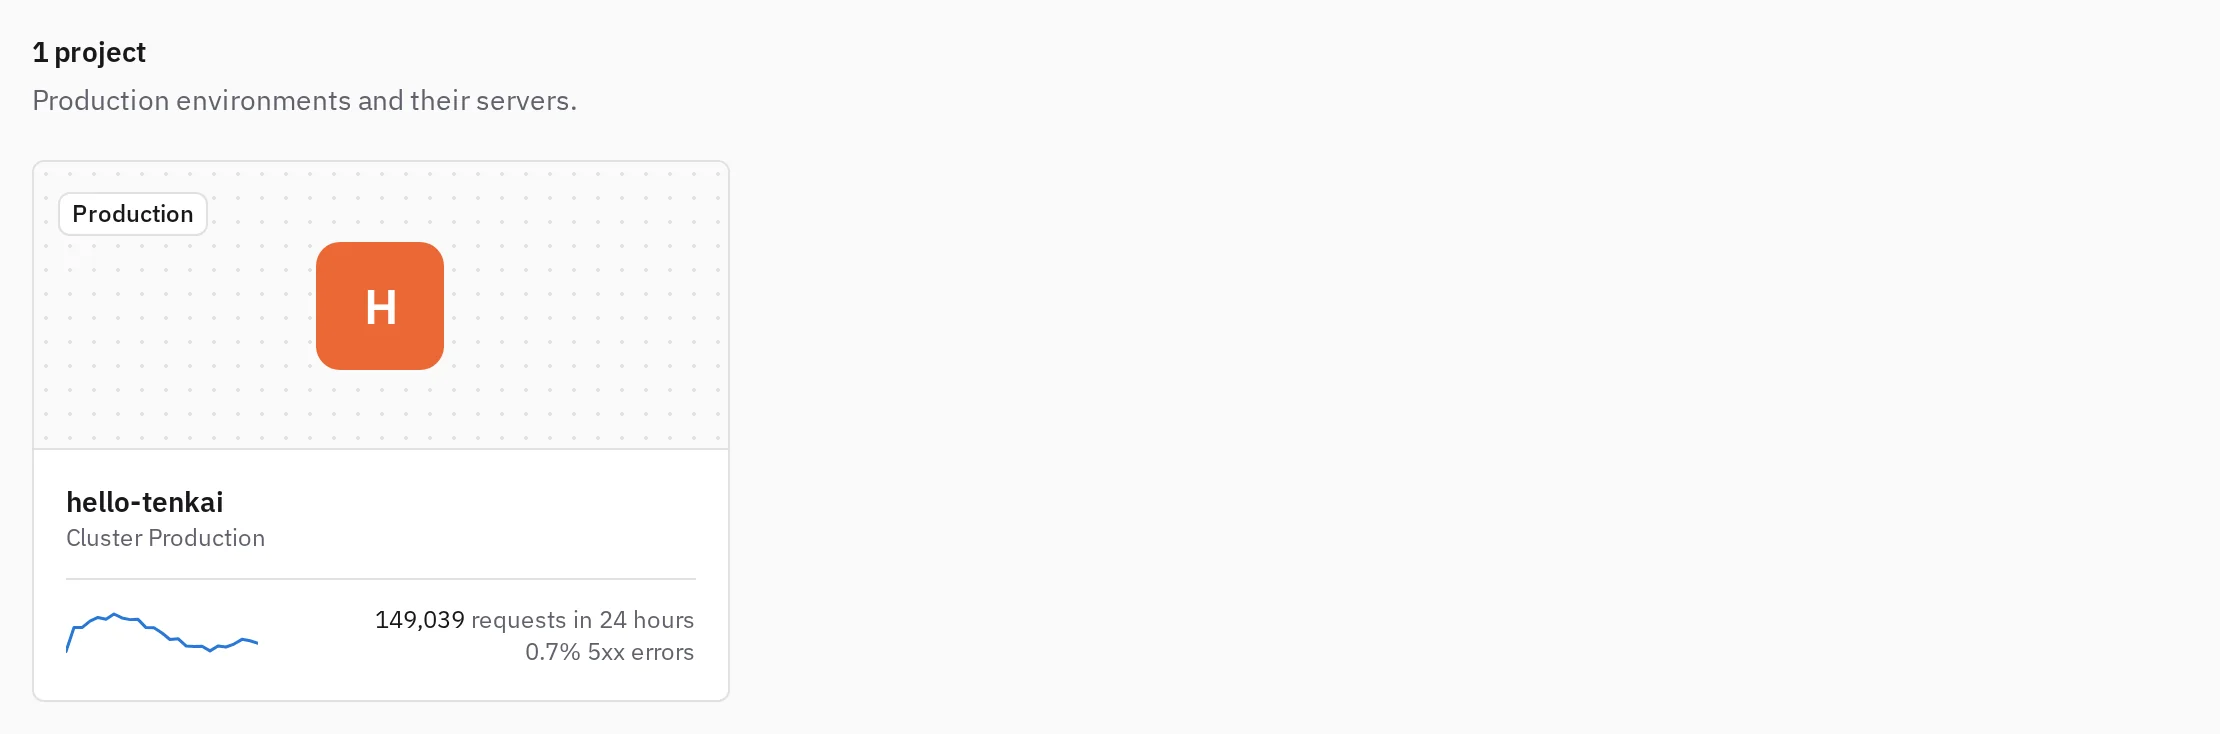
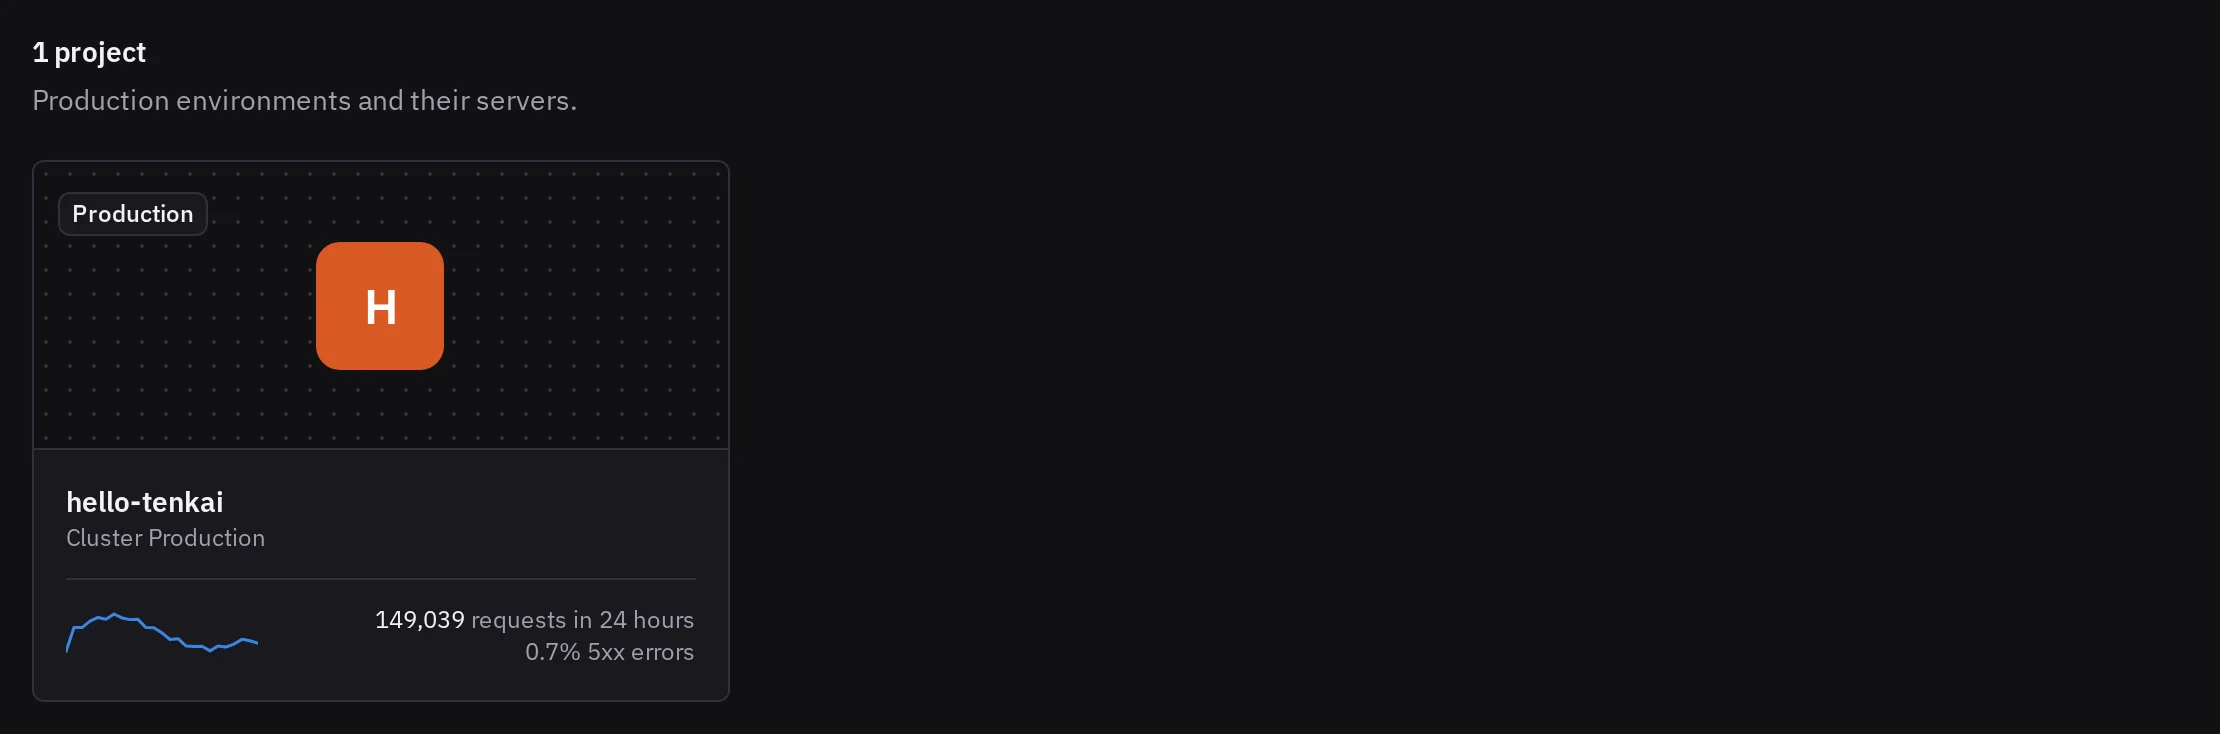
Open a project, then its Traffic tab, to compare its web applications over the last 24 hours. Choose one to open its own traffic tab.
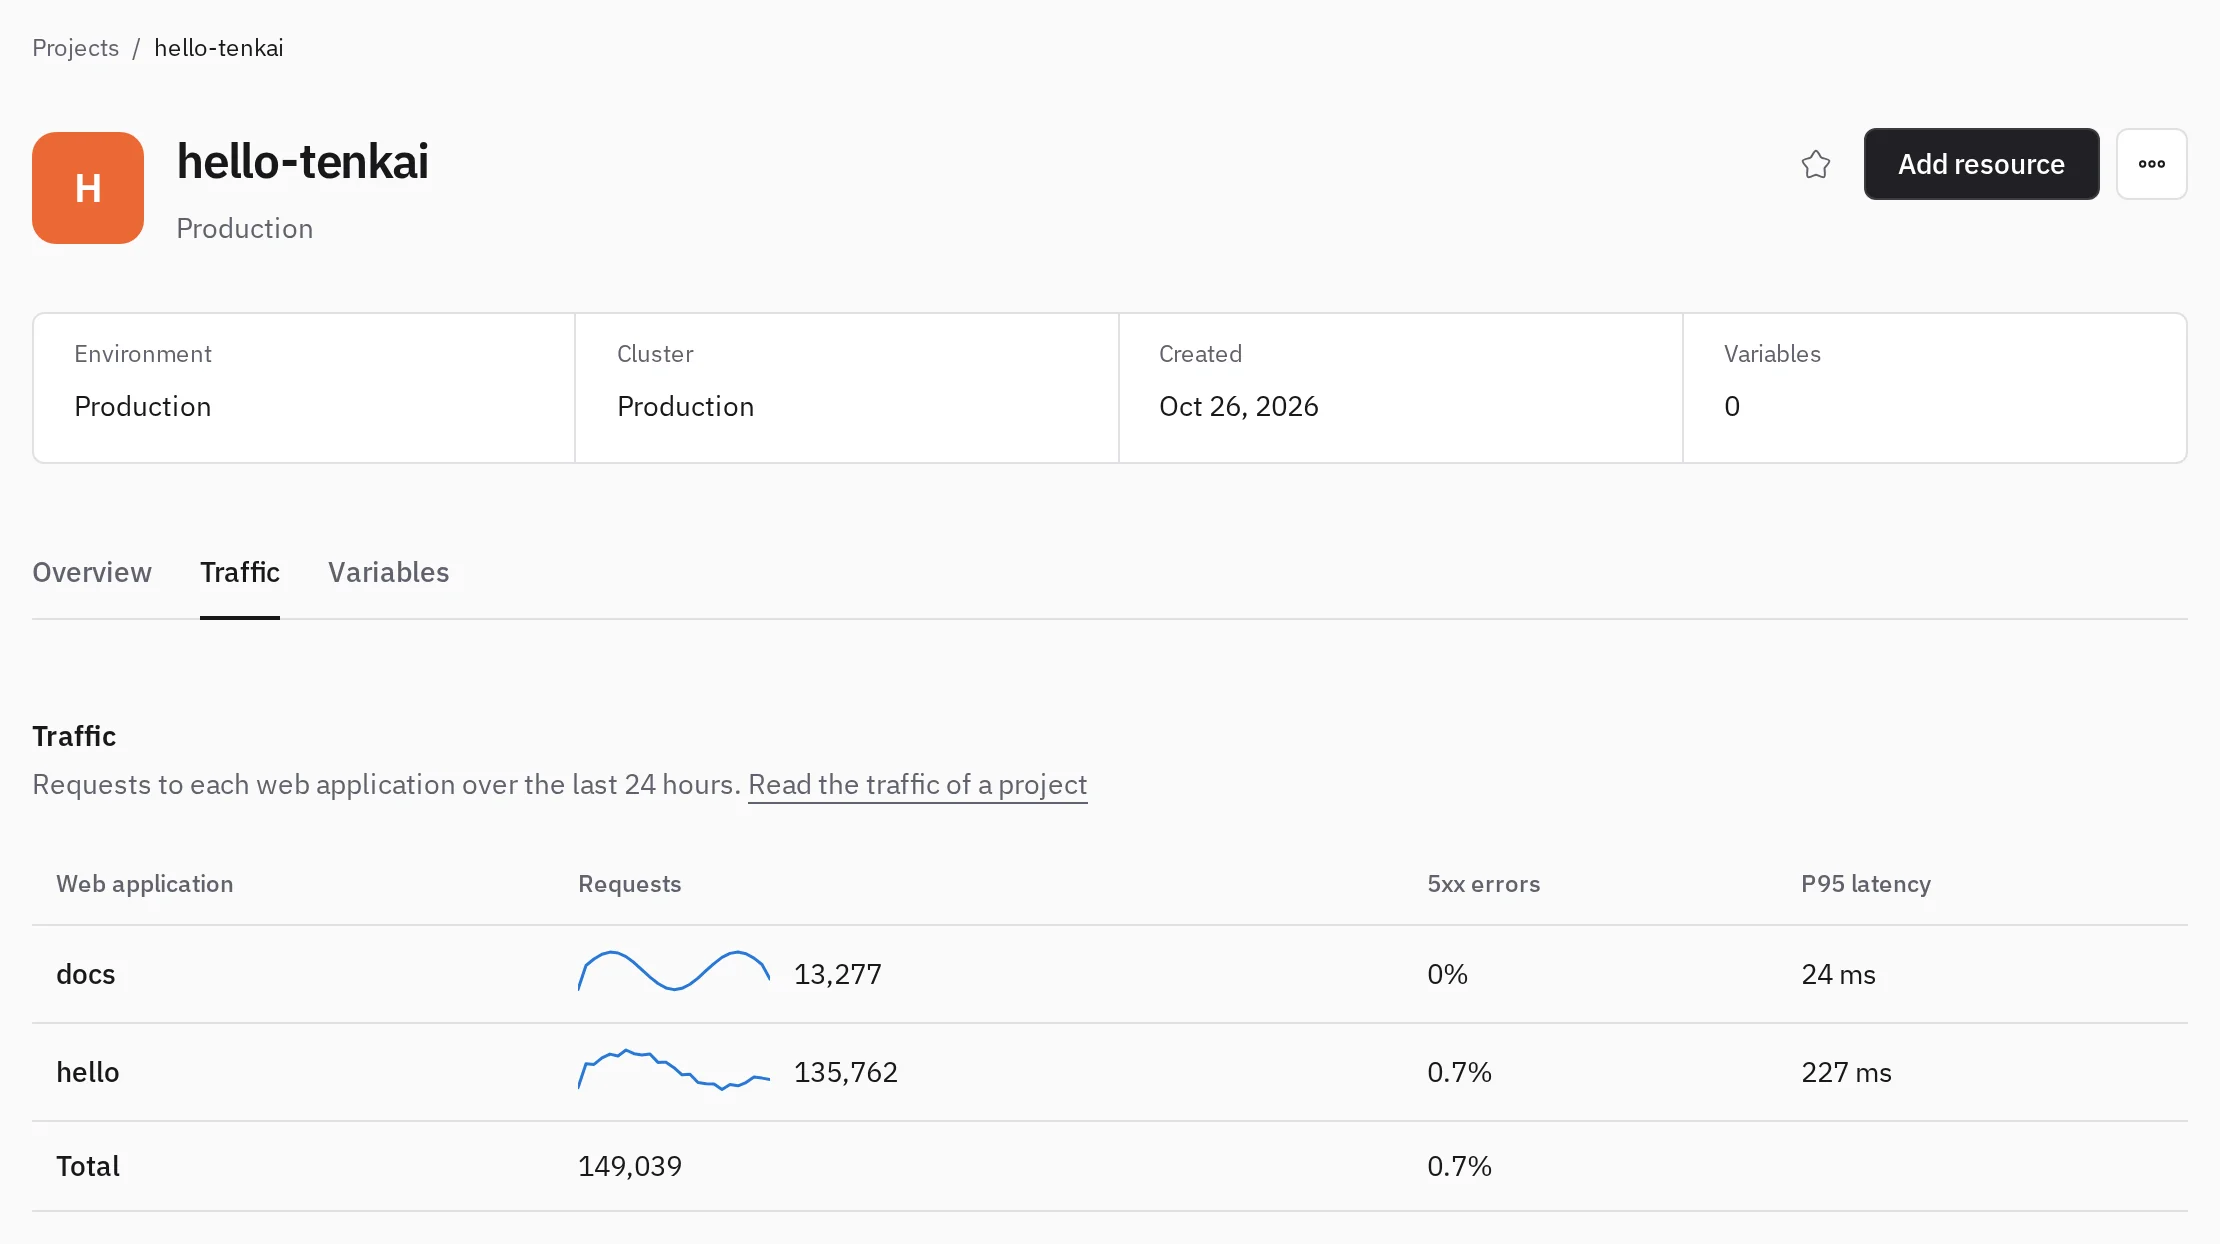
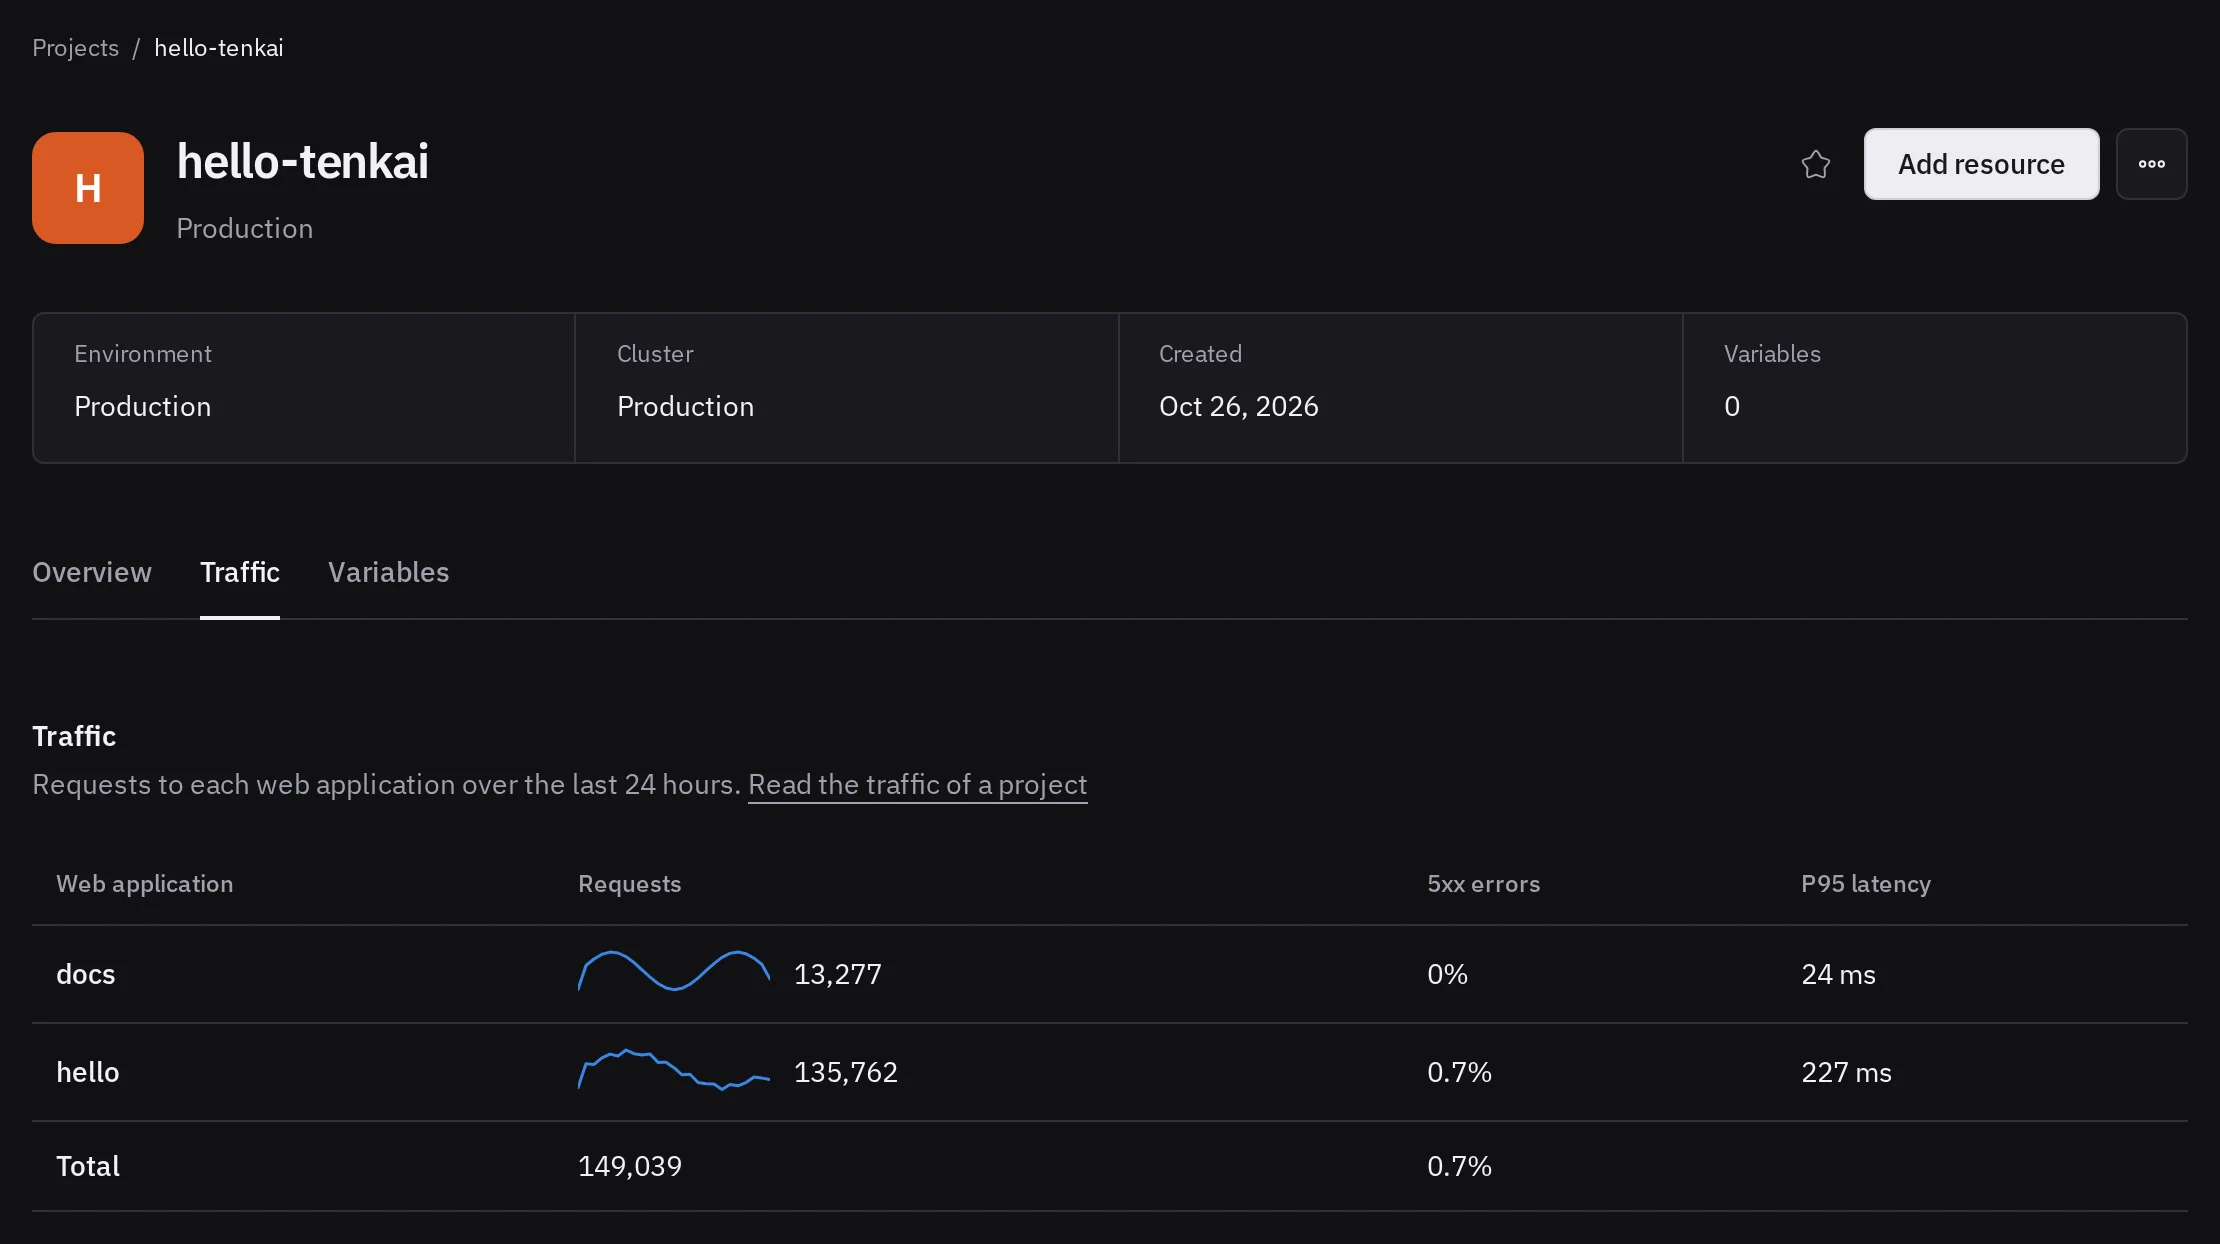
The total line has no latency: a percentile across several applications describes none of them. When a project runs on several clusters, what a cluster did not report is unknown, not zero: its small chart stops, and the total says which clusters it leaves out.
Read the latency
With a P95 of 210 ms, 95 requests out of 100 were answered in less than 210 ms. The P50 is the usual request; the P99 shows the slowest ones, which an average hides.
Latency runs until the end of the answer, so a large download or a streamed body raises the P99 without the application being slow. WebSockets and server-sent events (requests with Accept: text/event-stream) are left out of the latency.
A percentile is an estimate within an interval, such as 100 ms to 250 ms. over 10 s means above the last interval, by an unknown amount. A dash or a line that stops means too few requests: a P50 and P95 need 20 requests, a P99 needs 100. Choose a longer period.
What counts as a request
Tenkai counts requests to the web application on its default route and its custom domains. It does not count WebSockets, requests for a hostname no web application serves, requests to a managed service, or requests to the cluster storage.
Read a gap in the chart
A line that stops means Tenkai received no count for that time, not that there were no visitors; a minute without requests draws at zero. Gaps appear when the Tenkai Agent of the edge node is stopped, the edge node cannot reach Tenkai, or the server is down. Those requests are not recovered.
When the figures are partial
While the edge node moves, several nodes receive requests. If another node reports and the edge node does not, the figures miss the edge node's requests. Choose Open the edge node to see why its agent does not report.
When the tab shows no traffic
- No request yet: the web application received no request. Open its address, then wait a minute.
- No request counted: the edge node does not report, so it may have received some. Choose Open the edge node to see why.
- No traffic to show: the edge node's agent does not report. Choose Open the edge node, then install or update the Tenkai Agent from the server page.
- No traffic to show, with Open the cluster: the edge router is too old to count requests. An owner or admin updates the edge router from the cluster page.